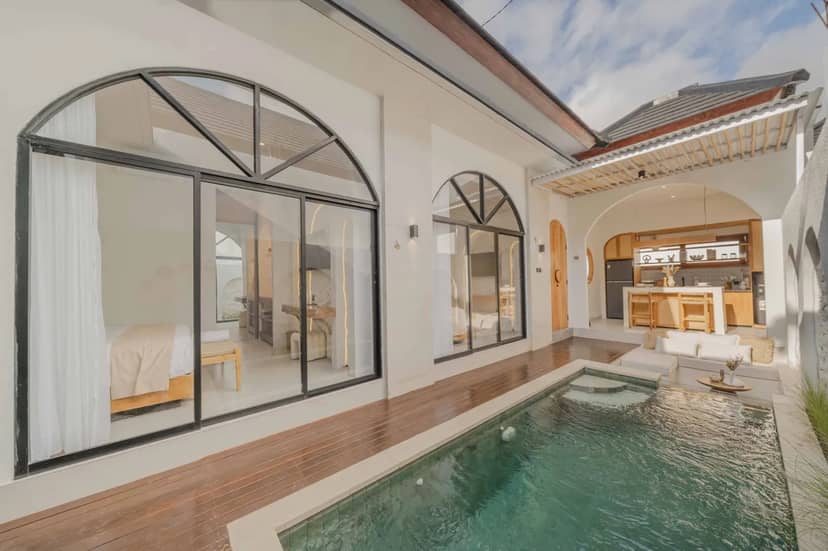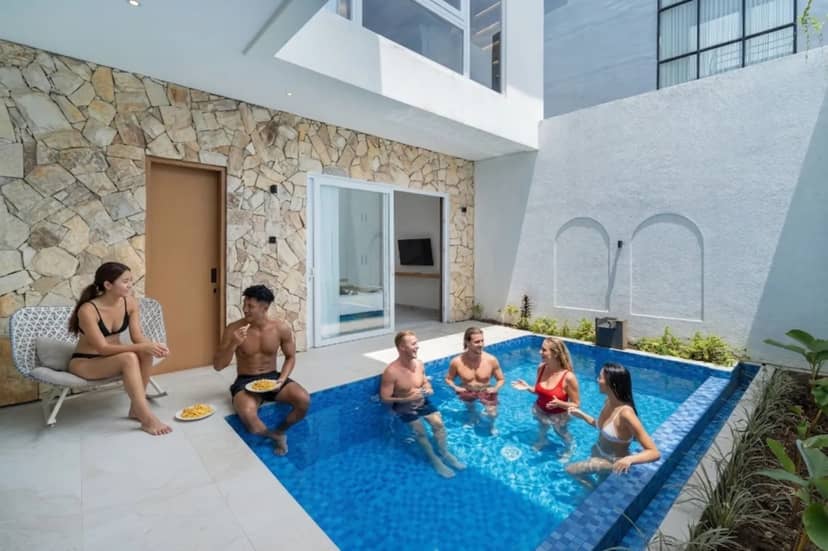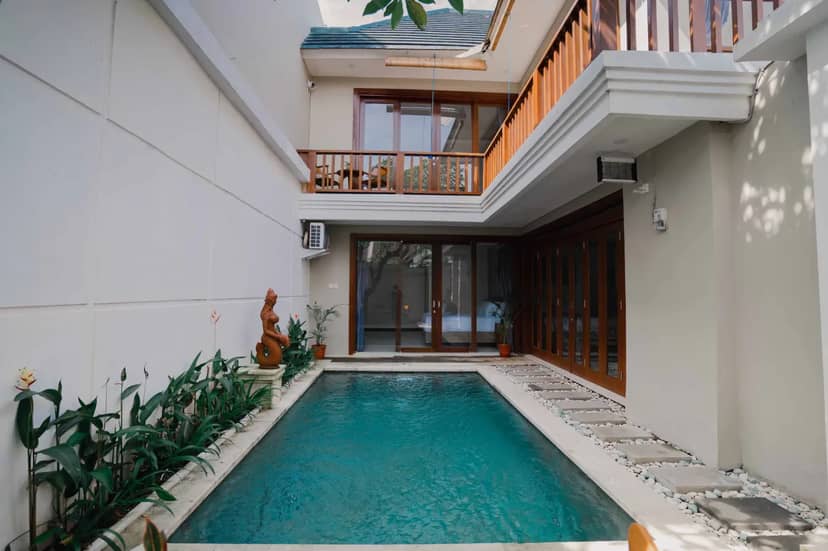
D'White Beach 3 BR Villa in Jimbaran (monthly)
Jimbaran · 3 bedrooms
Rp 45.000.000/ mo
Market data
Where reported yields and growth are highest in Bali, and the risks — a construction moratorium, marketing-driven numbers — the headline figures leave out.
Published 23 September 2026 · Updated 20 October 2026 · Rules checked 13 October 2026 · 6 min read
Tell the Baliestate assistant your budget and dates. It replies in minutes with homes that fit and books the viewings.
Every figure quoted for Bali property yields and growth comes from real estate agencies, developers, or marketing sites, because no government body or bank publishes an area-by-area index the way a national residential property price survey covers far coarser geography. That does not make the reported numbers wrong, but it means every one below is a claim by an interested party, not a measurement, and we have labelled it that way rather than presenting it as fact.
Jimbaran · 3 bedrooms
Rp 45.000.000/ mo
Jimbaran · 2 bedrooms
Rp 25.000.000/ mo
Jimbaran · 3 bedrooms
Rp 65.000.000/ mo
The Bukit is reported as the fastest-growing sub-market of the past two years, with land values cited up roughly 13% over twelve months and gross yields on managed luxury villas cited at 12–18%. The area's appeal is structural rather than a trend that could reverse quickly: it sits above the flood-prone lowlands, has less buildable flat land, and the cliff-and-surf product commands a genuine premium over rice-field villas. Building on cliff terrain is also reported to cost more than flat-land construction elsewhere on the island, which narrows the yield advantage once construction is priced in, not just the land.
Pererenan is reported to sell 20–30% below Batu Bolong and central Canggu for land drawing the same rental demand, with one source citing 22% land-value growth in a single year. The appeal is proximity without the price or the congestion — but proximity to Canggu also means proximity to Canggu's drainage problems, which is worth weighing against the discount, not just the discount itself.
Tabanan is reported to offer the island's lowest entry prices and highest headline growth potential, and it is also the area under the most direct regulatory pressure. Bali Perda 4/2026, signed by Governor Wayan Koster on 24 February 2026 in the wake of the September 2025 floods, controls converting productive agricultural land, which Tabanan has more of than the built-up south, and so restricts new tourism-accommodation permits there — a separate, later measure from the two-year hotel and villa permit freeze the central government placed on the already built-up Sarbagita area (Denpasar, Badung, Gianyar and Tabanan) back in October 2024. Cheap land in a district where you may not be able to build what you plan to build is not automatically a bargain — check the parcel's zoning and the regulation's current scope before any deposit.
One property-marketing source cites the average Bali villa price rising from roughly USD 321,000 to USD 484,000 over a year to 2025, with overall rental yields across property types cited around 8.5% annually. These numbers are widely repeated online, which makes them look more solid than a single unverified source actually is. We are stating them as reported, not as fact, and would not size an investment decision on them without independent verification.
The only area-by-area figures we found that do not come from someone selling property are for hotels. Horwath HTL's yearly Bali report uses figures from members of the Bali Hotels Association. Hotels are not villas, and these are not yields, but they show where guests pay most and where rooms sit empty.
Jimbaran & Uluwatu had the highest average rate and below-average occupancy. Canggu & Tabanan had the lowest occupancy of the named areas, down 19.5% on 2024, which Horwath HTL puts down to new supply and repositioning; Horwath HTL notes its Canggu sample was still being built up, so the change is less reliable than the level. Canggu also has the most hotel rooms in the pipeline: 1,480 of 5,641.
| Area | Hotel occupancy, 2025 | Average daily rate, 2025 | Rooms in the pipeline |
|---|---|---|---|
| Nusa Dua | 79.2% | IDR 3.1 million | 506 |
| Seminyak | 74.9% | IDR 2.4 million | 178 |
| Ubud | 68.6% | IDR 3.6 million | 1,044 |
| Jimbaran & Uluwatu | 66.0% | IDR 4.8 million | 1,263 |
| Canggu & Tabanan | 60.0% | IDR 2.2 million | 1,480 (Canggu) |
| All Bali | about 74% | IDR 2.35 million (USD 150) | 5,641 |
There is no independently verified ranking. Bukit Peninsula, Uluwatu and Pererenan are the areas most frequently cited by industry sources for yield and growth, but every figure behind that claim comes from parties with a sales interest — verify independently before committing.
The Bukit Peninsula is most commonly cited, with managed luxury villa gross yields reported at 12–18%. Treat this as an industry-reported range, not a guaranteed return.
Prices are reported as the lowest on the island, but Bali Perda 4/2026 (signed 24 February 2026, after the September 2025 floods) restricts new tourism construction on agricultural land and directly affects parts of Tabanan — check current zoning before buying.
No. There is no government or bank index at area level; every price and yield figure in circulation, including in this article, originates from real estate marketing sources. The hotel occupancy and rate figures here are from Horwath HTL, which measures hotels, not villa yields.
It's reported 20–30% cheaper than Batu Bolong and central Canggu for comparable rental demand, though this comes from a single property-marketing source, not an independent survey.
Treat them as a starting point, not a number to bank on. Verify against actual comparable rental listings and running costs for the specific property, since area-wide averages smooth over exactly the differences that determine a real return.
Tell the Baliestate assistant your budget and dates. It replies in minutes with homes that fit and books the viewings.
Price, yield and growth figures are reported by property-marketing sources, not independently verified against a government or bank price index. The hotel occupancy, rate and pipeline figures are from Horwath HTL's Bali Hotel & Branded Residences 2026 report (March 2026), read on 20 October 2026. Confirm any number before relying on it for an investment decision.